Run the protection test
Time: ~1 minute. You'll run the dashboard's eight-check pre-flight and see exactly which parts of the setup are done and which remain.
- Set up the environment and SDK complete
- Your server running at the registered URL
Run it
With your server running, open the Setup tab and click Run protection check (the button lives under the Verify protection panel):
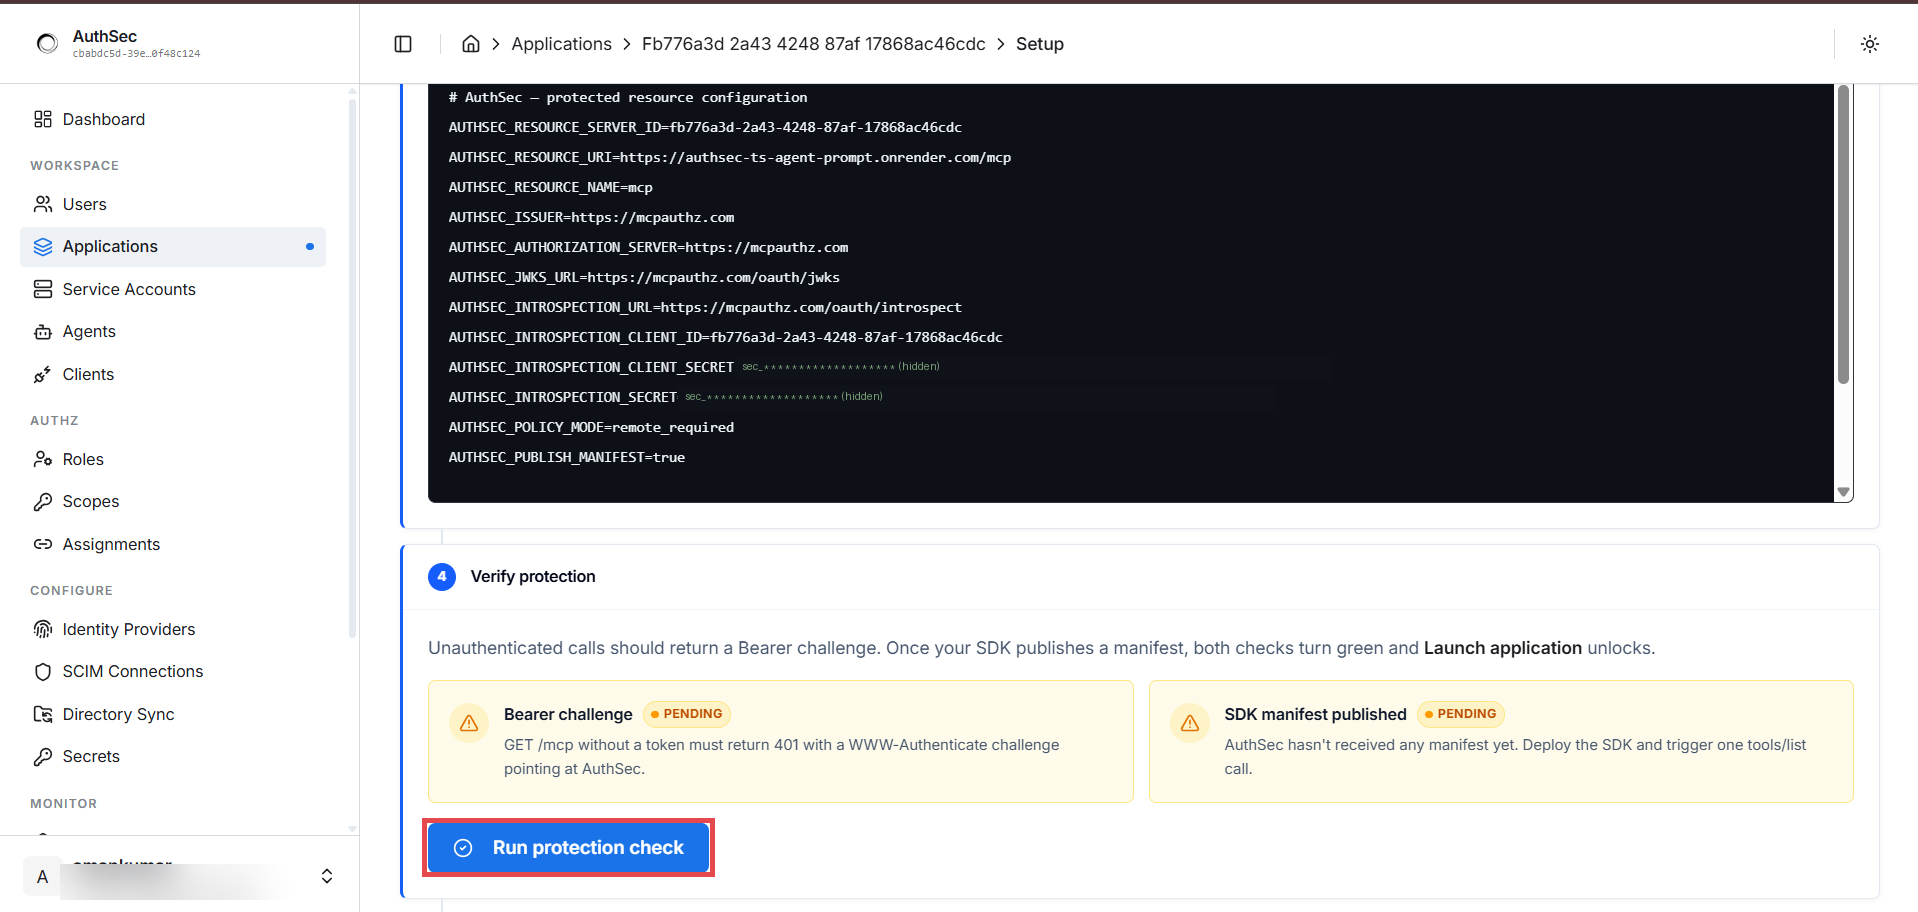
The dashboard probes your live server end-to-end and reports a checklist:
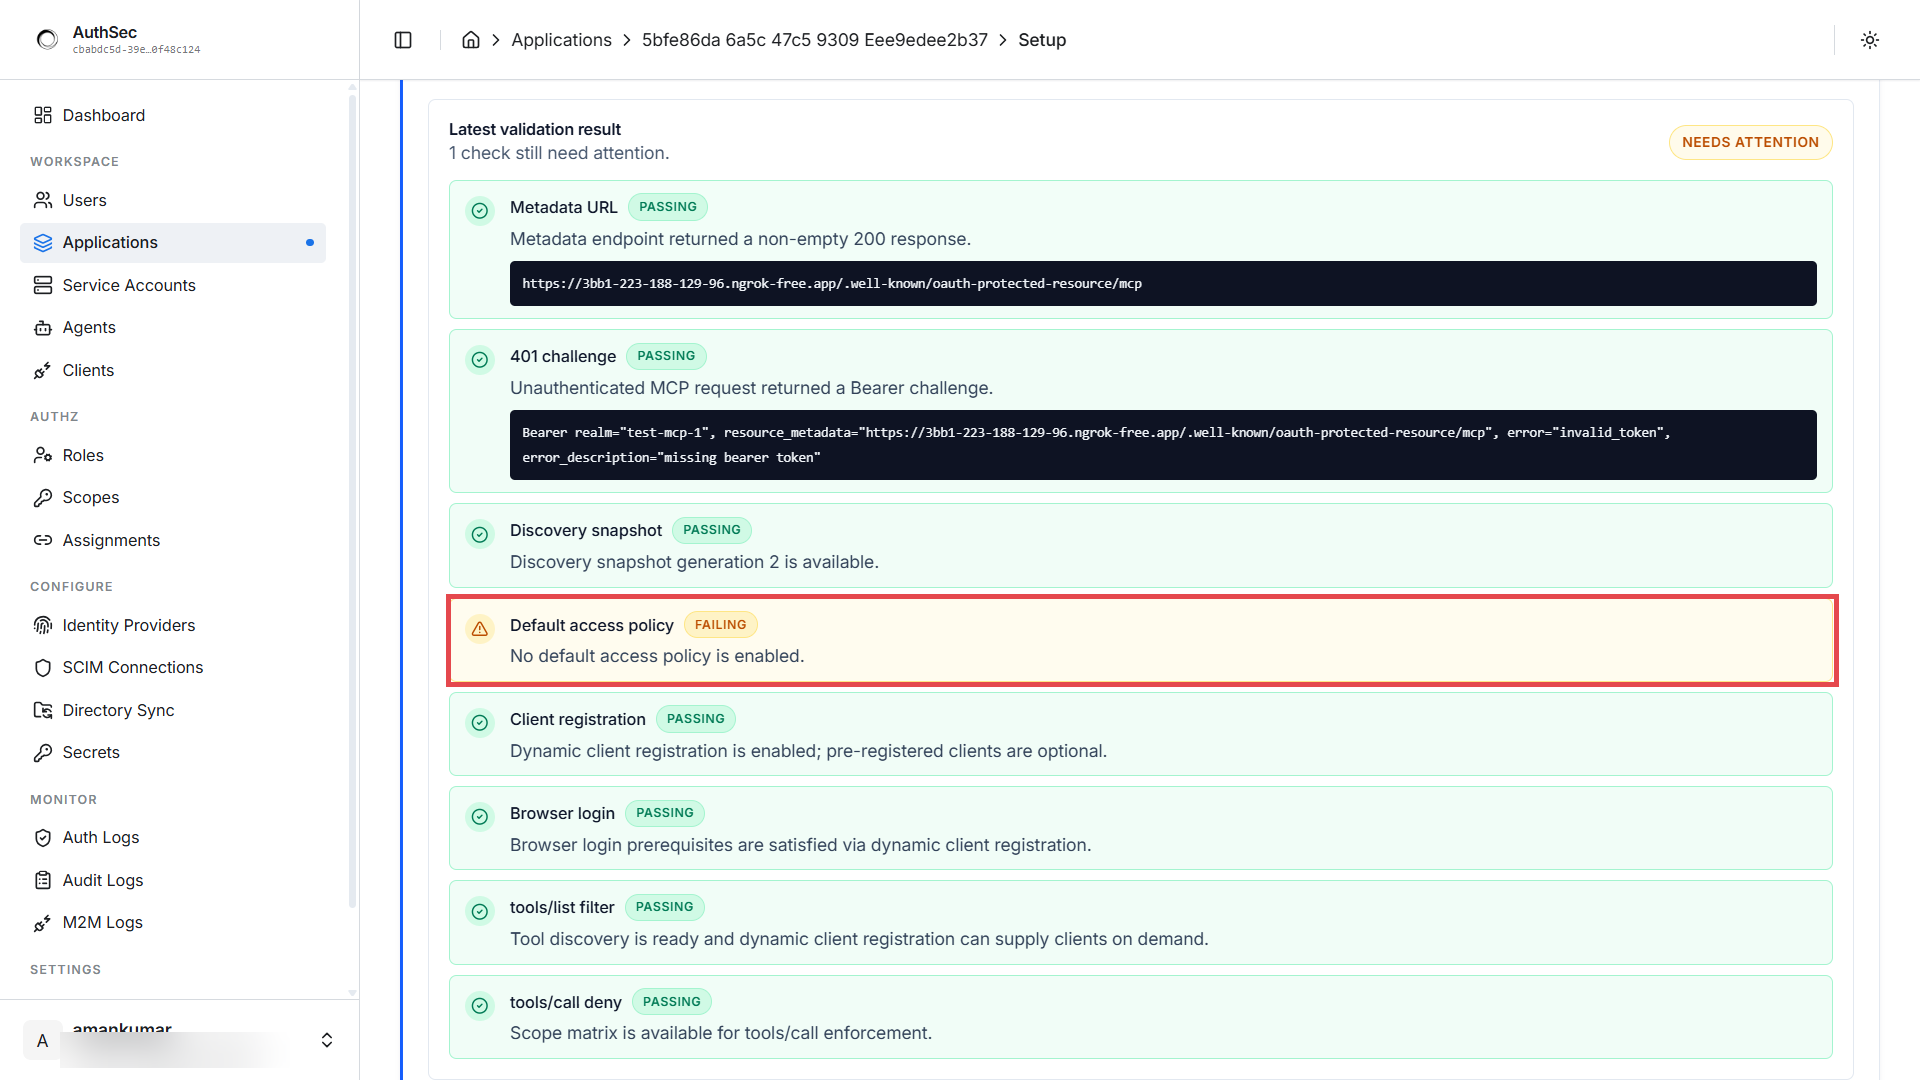
What each check proves
| Check | What the dashboard verified |
|---|---|
| Metadata URL | Your PRM endpoint (/.well-known/oauth-protected-resource/...) returns a non-empty 200 |
| 401 challenge | Unauthenticated MCP requests get a proper Bearer challenge with WWW-Authenticate |
| Discovery snapshot | Your server's discovery data was captured |
| Default access policy | A default role exists, so first-time callers get access |
| Client registration | Agents have a way to register (DCR / CIMD / pre-registered) |
| Browser login | User-login prerequisites are satisfied |
| tools/list filter | Tool discovery is ready for scope-filtered listings |
| tools/call deny | The scope matrix is available for per-tool enforcement |
The one that fails on a fresh app
Default access policy — "No default access policy is enabled." Everything your SDK serves is green; what's missing is a decision only you can make: what does a brand-new caller get?
Fix: Access tab → make a role the default → grant it scopes → save. Then re-run the check:
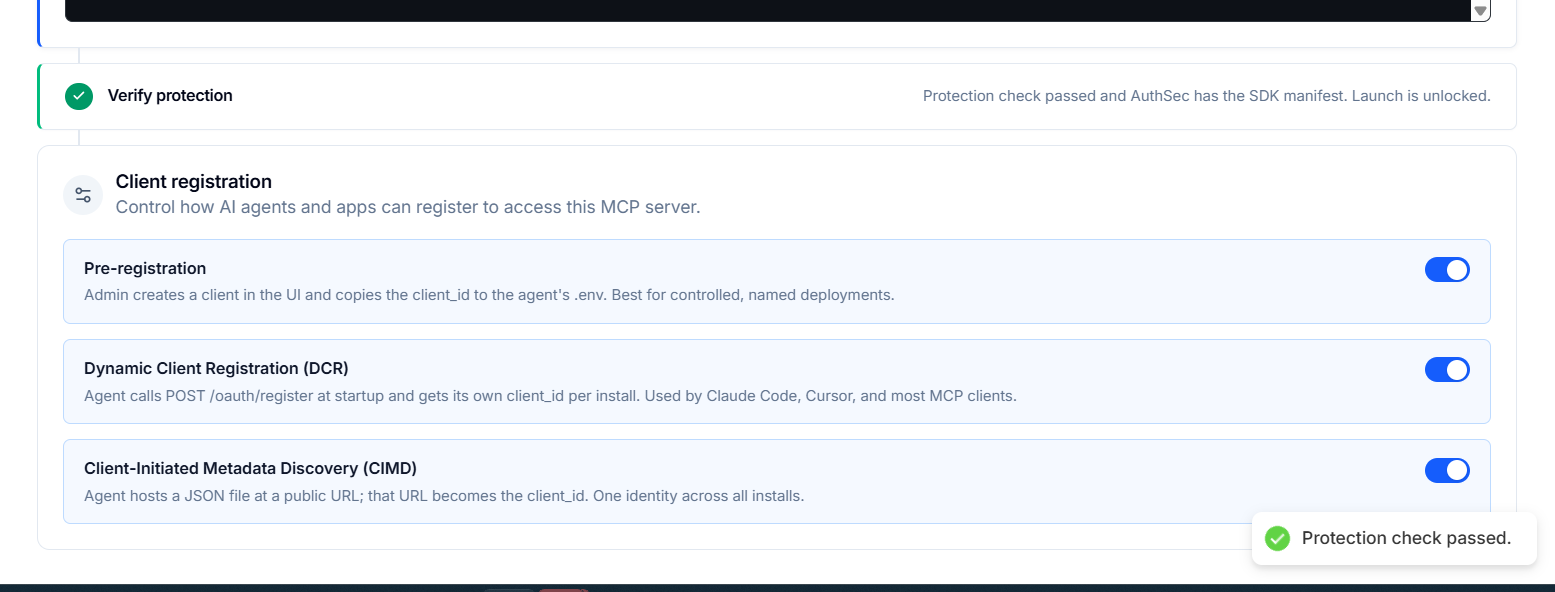
All green → Launch application unlocks.
What this test does NOT do
- It's not an end-to-end token flow — no real user login, no real tools/call with a token. For that, use a real agent (M2M or ID-JAG).
- It's not a latency or load probe.
It answers exactly one question: is the setup internally consistent and is the SDK responding correctly?